Why is an Entity Framework Core query slow and how do you fix it?

A spare-parts distributor went live in March with 300,000 orders and a "Customer orders" page that answered in 90 milliseconds. In November there are 4.2 million orders, the same page takes 4 seconds, support gets three calls a day and someone suggests buying a bigger server. Nobody has touched the code since June.
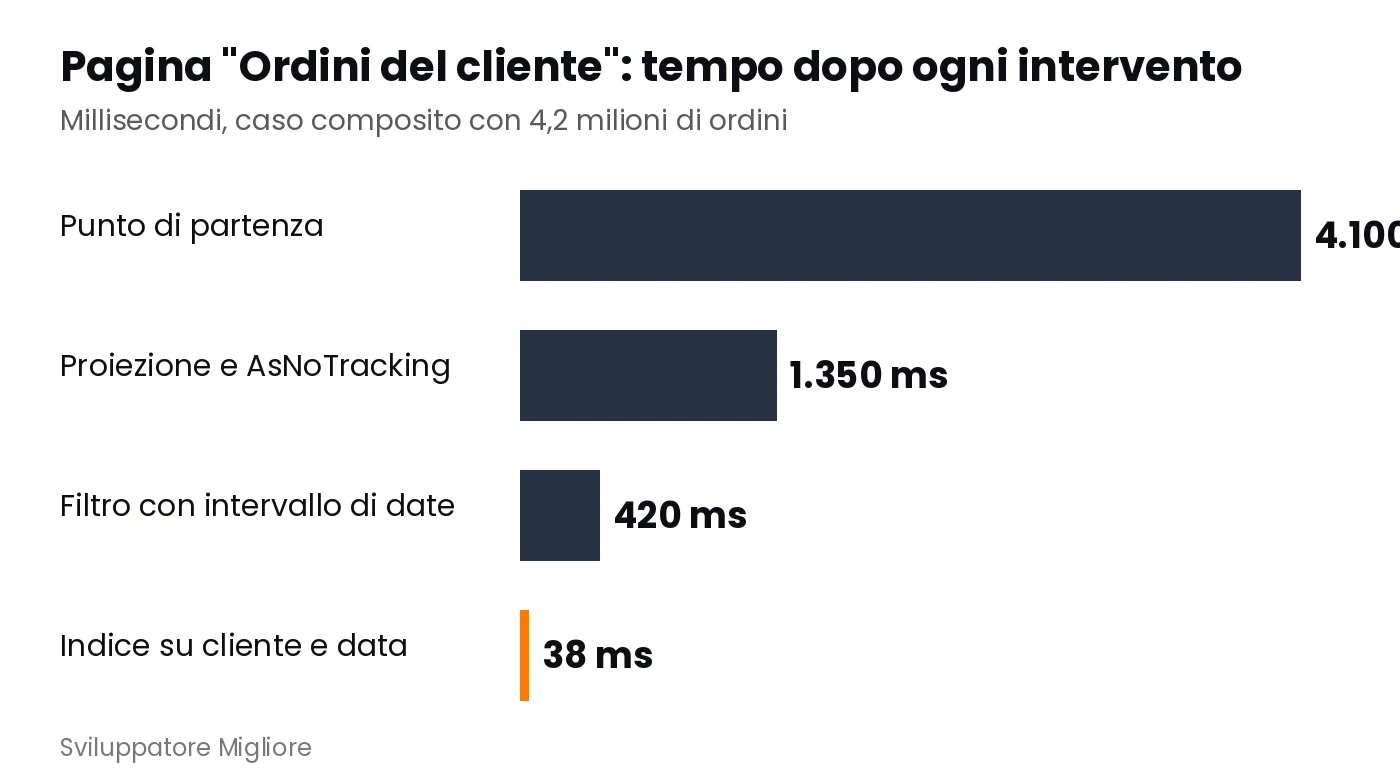
This is a composite case, built from situations I have seen many times: the numbers are realistic orders of magnitude, not a client's measurements. The story almost always ends the same way. The bigger server is not needed. Three steps are, in the right order: read what Entity Framework Core really sends to the database, look at the execution plan SQL Server picks, and fix the query or the index that sends it the wrong way. In this case the page drops from 4,100 to 38 milliseconds with no new hardware. If you are still choosing the tool, start from Dapper or Entity Framework Core.
Why does an Entity Framework Core query get slow when data grows?
A query gets slow when SQL Server has to read many more rows than it returns. With 300,000 orders the useless reading costs a few milliseconds, with 4 million it costs seconds: the code is the same, the hidden work grew.
Entity Framework Core translates LINQ into SQL, and the database optimizer then chooses indexes, join order and memory. Slowness starts in one of two places: the translation (the SQL is heavier than needed) or the plan (no useful index, stale statistics, a full table read). A bigger server gives you 20-40% on a query that reads millions of useless rows. A well-chosen index gives you 99% for half a day of work. The economics for ageing systems are in what legacy software really costs.
How do you find the slow query without guessing?
Look at what the application really sends: the Entity Framework Core command log in development, an interceptor that flags queries over a threshold, and Query Store in SQL Server for production. Three free tools, about an hour of work.
// Development: write every SQL command with its duration to the console.
builder.Services.AddDbContext<OrdersDbContext>(options =>
{
    options.UseSqlServer(builder.Configuration.GetConnectionString("Orders"));
    if (builder.Environment.IsDevelopment())
        options.LogTo(Console.WriteLine, new[] { DbLoggerCategory.Database.Command.Name }, LogLevel.Information);
});

// Production: flag commands over 500 ms.
public sealed class SlowQueryInterceptor(ILogger<SlowQueryInterceptor> log) : DbCommandInterceptor
{
    public override ValueTask<DbDataReader> ReaderExecutedAsync(
        DbCommand command, CommandExecutedEventData data, DbDataReader result, CancellationToken ct = default)
    {
        if (data.Duration > TimeSpan.FromMilliseconds(500))
            log.LogWarning("Slow query ({Ms} ms): {Sql}", (int)data.Duration.TotalMilliseconds, command.CommandText);
        return new ValueTask<DbDataReader>(result);
    }
}
In Management Studio, the Query Store report "Top Resource Consuming Queries" lists the ten heaviest queries by total time. The most dangerous is not always the slowest: an 80 ms query called 400,000 times a day weighs more than a 6-second query called twice. Add TagWith("Customer orders") to important queries so the SQL carries a comment telling you where it came from.
How do you read a SQL Server execution plan?
The execution plan is the map of steps SQL Server follows. Read it right to left and look for three signals: reads of a whole table, estimated rows far from actual rows, and yellow warnings. That covers most problems.
Press Ctrl+M in Management Studio for the actual plan and add SET STATISTICS IO ON: the number of logical reads is the most honest measure, because time varies between runs and reads do not. An Index Seek finds rows through the index, like looking up a surname in a sorted phone book. A Scan reads everything and on 4 million rows is the culprit. A Key Lookup goes back to the table for the other columns and hurts when it happens 20,000 times. If the plan expected 10 rows and 400,000 arrived, statistics are stale or the filter is written in a way the optimizer cannot use.
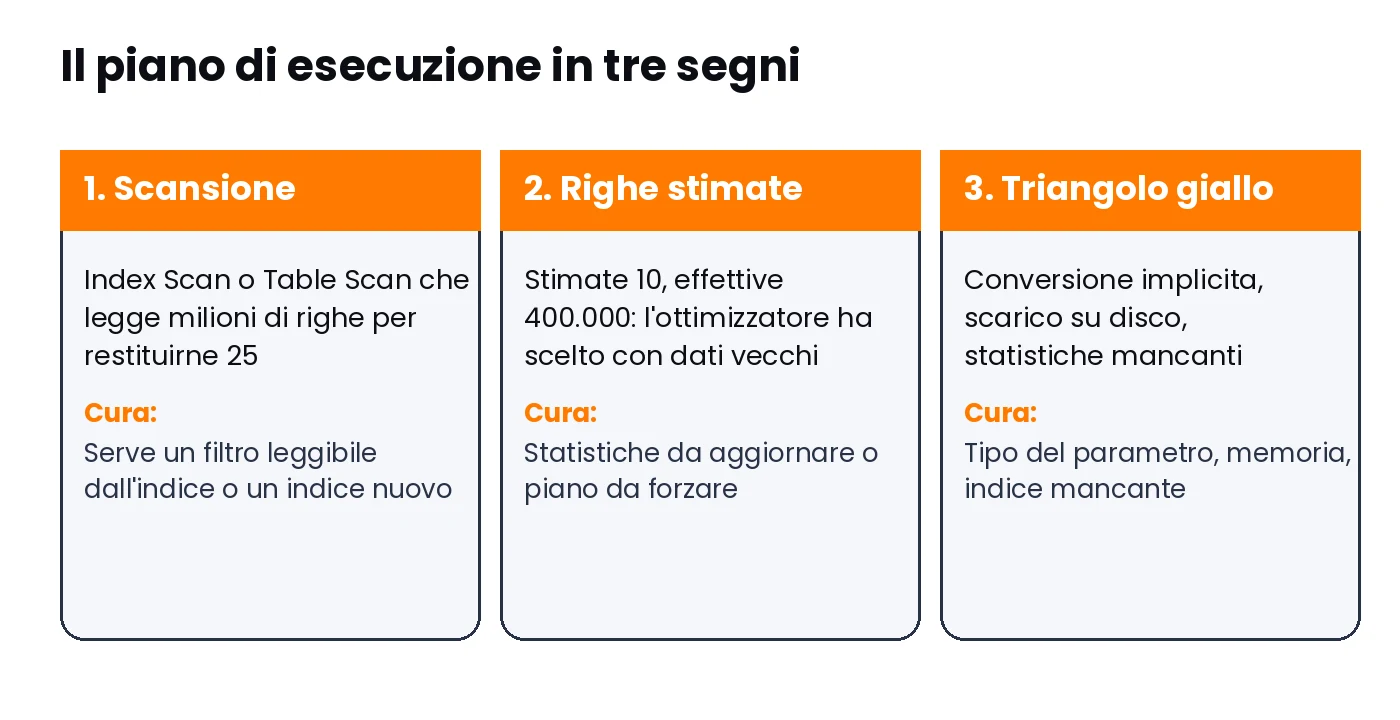
The "Customer orders" page showed an index scan of 4.2 million rows to return 25, 11,000 key lookups and a sort spilled to disk. Three signals in one drawing.
Why does a multi-level Include slow the page down?
Every Include adds columns and duplicated rows to the result: orders, lines and products in one query return a row for every combination. The cure is to load only the columns the page shows, with a projection.
// After: a projection on a read-only type, without change tracking.
public sealed record OrderRow(int Id, string Number, DateTime OrderDate, string Customer, decimal Total, int Lines);

var orders = await db.Orders
    .AsNoTracking()
    .TagWith("Customer orders")
    .Where(o => o.CustomerId == customerId)
    .OrderByDescending(o => o.OrderDate)
    .Skip(page * 25).Take(25)
    .Select(o => new OrderRow(o.Id, o.Number, o.OrderDate, o.Customer.Name, o.Total, o.Lines.Count))
    .ToListAsync();
If you must edit an order and its lines, load them fully but use AsSplitQuery(): one query per collection instead of one query with duplicated rows. In our case projection and no tracking moved the page from 4,100 to 1,350 milliseconds.
Which LINQ filters stop SQL Server from using the index?
A filter defeats the index when it applies a function to the column: a year extracted from a date, text lowercased, a search with a leading wildcard. SQL Server must compute the value for every row, so it reads the whole table.
o.OrderDate.Year == 2026 becomes DATEPART(year, [OrderDate]) = 2026. Rewrite it as a half-open range: o.OrderDate >= new DateTime(2026,1,1) && o.OrderDate < new DateTime(2027,1,1). On SQL Server the default collation is case-insensitive, so ToLower() is useless work, and Contains becomes LIKE '%text%', which no normal index helps. The sneakiest case is the implicit conversion: Entity Framework Core sends strings as nvarchar, and if the column is varchar SQL Server converts the column row by row. Fix it with .Property(o => o.Number).IsUnicode(false). In our case the date range moved the page from 1,350 to 420 milliseconds.
Which indexes do you really need and how do you declare them?
You need an index shaped like the query: equality-filter columns first, then the sort column, then the other needed columns as included columns so the engine never goes back to the table. You declare it in the model and the migration creates it.
modelBuilder.Entity<Order>()
    .HasIndex(o => new { o.CustomerId, o.OrderDate })
    .IsDescending(false, true)
    .IncludeProperties(o => new { o.Number, o.Total })
    .HasDatabaseName("IX_Orders_Customer_Date");
Every index speeds up reads and slows writes a little, so you add one per important query, not one per column, and you drop unused ones (sys.dm_db_index_usage_stats shows how often each was read). With this index the page went from 420 to 38 milliseconds: 4,100, 1,350, 420, 38. Three fixes, two days of work. See also moving an Access database to SQL Server: indexes are designed on real queries, not on tables.
What is the N+1 problem and how do you spot it in the log?
N+1 happens when the code runs one query for the list and one more for every item. With 25 rows that is 26 trips; with 2,000 rows, 2,001. You spot it in the log, where the same SQL appears dozens of times.
It hides in a foreach that calls FindAsync for each order, or in lazy loading, where touching order.Customer.Name inside a loop fires a hidden query. Each trip costs 1-3 ms of network alone, so 2,000 trips are 2-6 seconds. Fix it with a projection or load related rows in bulk with one Contains query. For mass updates and deletes, ExecuteUpdateAsync and ExecuteDeleteAsync do in one command what used to need loading every row. More on lazy loading in optimizing lazy loading in Entity Framework.
Does Skip and Take paging hold up at page 4,000?
No: Skip and Take get slower with every page, because the database still reads and discards all earlier rows. For long lists use keyset paging: ask for "the 25 rows after the last one seen", not "skip the first 100,000".
Keyset paging filters on the last date and id received (o.OrderDate < lastDate || (o.OrderDate == lastDate && o.Id < lastId)), orders by the same columns and takes 25: constant time on every page with the right index. The total count costs as much as reading everything, so show "more than 10,000" with Take(10001).CountAsync(), keep a nightly counter, or drop the number. Compiled queries (EF.CompileAsyncQuery) save fractions of a millisecond per call; if your query takes 4 seconds, the problem is in the database, so use them last.
Why is the query fast in Management Studio and slow in the application?
Almost always parameter sniffing: SQL Server builds the plan with the first value it receives and reuses it. If the first value is rare and the next common, the plan is wrong for most calls.
A customer with 40 orders and one with 600,000 need different paths, but the cached plan is one. The sign is variability: same query, two customers, very different times. Query Store's "Queries with multiple plans" report confirms it. Three cures, safest first: force the good plan from Query Store (one click, reversible); add OPTION (RECOMPILE) through an interceptor that recognises the TagWith comment, since Entity Framework Core has no dedicated hint method; or split the query for small and large customers. Keep statistics fresh with a nightly job, and always write the undo command before the apply command. If the doubt is the type of store and not the query, see when Azure Cosmos DB pays off.
How do you stop slow queries from coming back?
With three automatic checks: a test that counts the queries a page makes, a test database with realistic volumes, and a production alert on queries over the threshold. If a check fires, the change does not pass.
Most slow queries come from a small change nobody measured: one more Include, a rewritten filter. Put the measurement where changes pass. An interceptor that increments a counter lets an integration test assert that the orders page runs at most 3 commands, which catches N+1 the day someone introduces it. Test with volumes that look real: an anonymised copy of production or a generator with a few huge customers and many small ones, which is exactly where plans go wrong. Wire the slow-query interceptor to Application Insights and lower the threshold every month. The same discipline helps when restructuring old code, as in legacy code refactoring with AI.
How long does it take and what does it cost to fix the slow queries of a business application?
For five to ten critical pages it takes 3-6 person-days, so 1,800-3,600 euro at 600 euro a day. A bigger server costs the same over a year and leaves the cause. The first day is enough to know whether the problem is in the code or in the data.
- Turn on the command log in development and the slow-query interceptor in production.
- Open Query Store, sort by total time and note the top ten.
- For each, paste the SQL in Management Studio with
Ctrl+MandSET STATISTICS IO ON. - Look for scans, key lookups, estimated against actual rows and yellow triangles.
- Fix in this order: projection, index-friendly filters, index, paging.
- Measure logical reads before and after and write them next to the change.
- Add the query-count test and a time threshold, then move to the next query.
If pages stay slow after this, the problem is structural, and splitting commands from reads is often the right move: see CQRS, when the pattern pays off, Domain-Driven Design in C# and, if the doubt is repair or replace, rewrite or refactor.
The distributor did not buy the bigger server. It removed two levels of Include, wrote the year as a date range, declared an eight-line index and added a test that counts queries. The page that took four seconds answers in 38 milliseconds, support stopped getting calls and the owner spent less than three thousand euro.
If you want to learn to diagnose this yourself, read an execution plan, decide where an index is needed and where the query must change, and design data access for a system that has to last, in the C# course by Sviluppatore Migliore we work on real projects with my direct feedback, in recorded lessons and live sessions that fit around your job. Bring your slowest query: we open it together.
Does your company need custom software or AI in the team?
We design and build custom software, modernize legacy systems and train your developers to work with AI. Tell us the problem: you get a concrete answer within one working day.
Frequently asked questions
Because SQL Server reads far more rows than it returns: a useful index is missing, the filter applies a function to the column, an Include loads duplicated rows or the code runs one query per item. The command log and the execution plan show which cause matters.
Turn on command logging with LogTo in development, add an interceptor that flags commands over a threshold (for example 500 milliseconds) and open Query Store in SQL Server to see the ten most expensive queries. ToQueryString shows the SQL of a single query.
Enable the actual plan with Ctrl+M in Management Studio and look for scans instead of seeks, estimated rows far from actual rows, many key lookups and yellow warning triangles. SET STATISTICS IO ON adds logical reads, the most stable measure.
Often, but only if it has the right columns in the right order: equality filters first, then the sort, then included columns to avoid going back to the table. A filter that applies a function to the column, such as the year taken from a date, makes any index useless.
The code runs one query for the list and one more for every item, typically in a loop or through lazy loading. With 2,000 rows that is 2,001 trips to the database. Fix it with a projection, a targeted Include or a bulk load.
Usually parameter sniffing: SQL Server builds the plan with the first value it sees and reuses it. If the next value has a very different distribution, the plan is wrong. Query Store lets you force the good plan without touching the code.
For five to ten critical pages it takes 3-6 person-days, so 1,800-3,600 euro at a reference rate of 600 euro a day. A bigger server costs about the same over a year and leaves the cause untouched.
Leave your details in the form below