What is the number that decides whether transport management software will actually make you money?
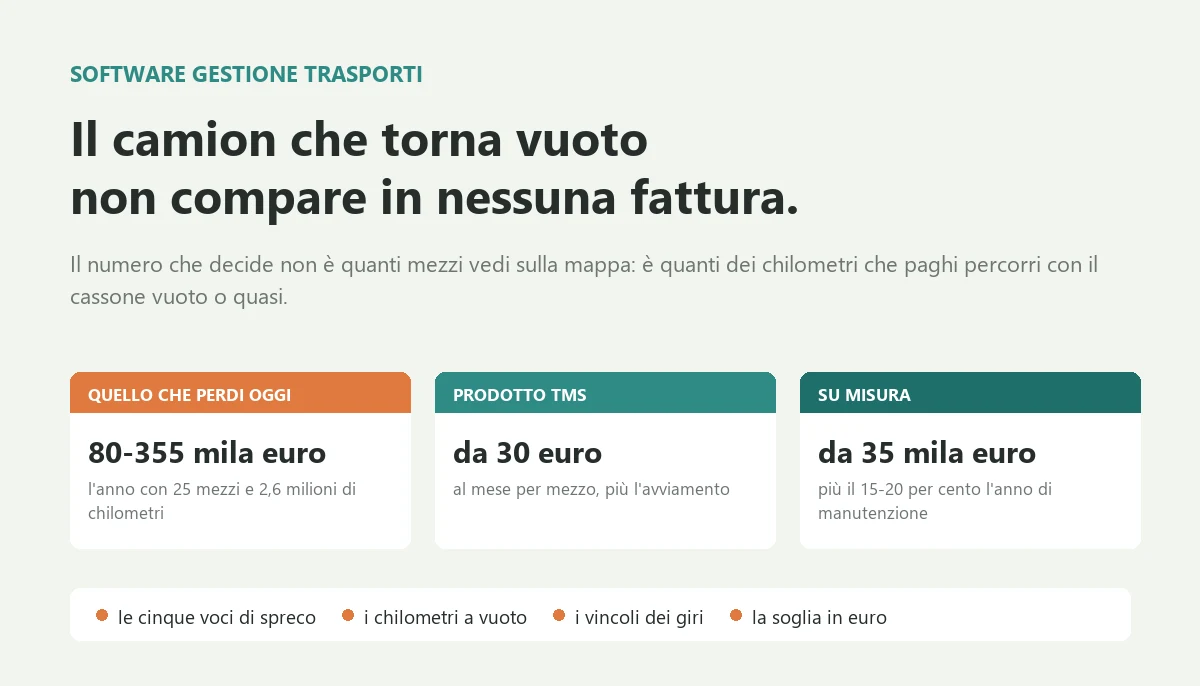
In companies with their own fleet that never measured it, the empty share often sits between fifteen and thirty per cent, and with twenty five vehicles the five waste items cost between eighty and three hundred and fifty five thousand euro a year. A product costs between thirty and ninety euro per vehicle a month plus setup, a custom system starts at thirty five thousand euro. Below twenty thousand euro a year of spend the product almost always wins, and clean delivery point data always comes before the optimiser.

The owner had twenty six vehicles, thirty four drivers and a traffic office of three people who, every evening between five and eight, built the next day's routes on a whiteboard, two spreadsheets and the phone. It worked, in the sense that deliveries went out. When we lined up the tachograph data against a quarter's delivery notes for the first time, it turned out that one kilometre in four was driven with the load bed nearly empty, and that the return legs from Bologna and Brescia, two fixed lanes, had been coming back empty for three years while a company forty kilometres from Brescia was giving its loads to a competitor. That is the problem transport management software is supposed to solve, and it is also the one no software solves on its own.
If you recognise the scene, this article gives you the real cost of planning routes by hand, the single number that tells you whether a system will make you money or just show you the trucks more clearly on a map, how to plan routes around the real constraints, how far a spreadsheet and a phone take you, the three different things vendors all sell under the same name, the real price bands for a product, the module of the ERP you already own and a custom system, and the threshold in euro beyond which the maths changes.
I have been writing software since 1999 and I have seen logistics from the inside in very different forms: distributors with their own fleet delivering to shops before ten, manufacturers shipping pallets with different carriers every week, haulage companies with fifty vehicles and three point margins, installers sending vans with materials and crews out every morning. I also built and sold a software product used by many companies, and I know what it takes to make a system work when the person on the other end works with their hands and has no time for an app that freezes.
What I learnt, and what no vendor says during the demo, is this: the number that decides is not how many vehicles you can see on the map, it is how many of the kilometres you pay for are driven with the load bed empty or nearly so. The live map is the part that sells best and earns least: it tells you where the truck is, not why it is there. The money is in the kilometres you should not have driven, and those do not show up on any screen until somebody counts them.
What transport management software is, and what it is not
Transport management software, often shortened to TMS, is the system that holds together three jobs that today probably live in three different places: planning, meaning deciding which vehicle carries which load in which order; execution, meaning knowing what happens during the route and having proof the delivery took place; and costing, meaning knowing what every trip cost and invoicing it without rebuilding it by hand. It answers a single question, every day: are we carrying what we have to carry with the kilometres and hours it takes, and no more.
You will find it on the market under different names, and the confusion suits whoever is selling. Transport software, logistics software, haulage software, fleet management, GPS tracking, route optimisation, carrier platforms. They overlap only in part, cost very different amounts and solve different problems. A box that sends the truck's position every thirty seconds plans nothing, and a route optimiser that does not know your customers' time windows produces beautiful routes no driver can run.
The difference between knowing where the trucks are and deciding where to send them
Almost every company that writes to me already has part of the problem covered. They have vehicle tracking, often required by the insurer or the leasing company. They have the ERP that issues delivery notes and invoices. They have the tachograph, which by law records driving and rest times. And they have a good person, sometimes two, who knows the customers, the roads, the drivers and their habits, and who every evening does a jigsaw no system has ever seen.
The point is that these pieces answer questions different from yours. Tracking answers where the truck is now. The ERP answers what you have to invoice. The tachograph answers whether the driver respected the hours. Your question is another one: what did that route cost, what should it have cost, and why the difference. None of the three pieces sees it, because the answer lies in comparing what was planned with what happened, and today that comparison is done from memory by the good person in the traffic office.
Then there is time, as always. A plan made the evening before holds until nine in the morning, when a customer brings a delivery forward, a truck breaks down and a driver calls in sick. From then on the phone rewrites the plan, and decisions made on the phone leave no trace. At month end nobody knows why the Verona articulated lorry drove six hundred kilometres instead of four hundred, and the cost of that day ends up in the average, where it bothers nobody.
The three kinds of companies looking for it, and looking for different things
Hauliers working for third parties. Road carriers and forwarders, from ten to a hundred vehicles. Here transport is the product, the margin is a few percentage points and every empty kilometre is margin walking out of the door. The value lies in vehicle utilisation, loaded return legs and invoicing exactly everything that was done, waiting time included. Vendors selling to these companies show the map, and they miss the target: the target is the profit and loss of the single trip.
Companies with their own fleet distributing what they make or sell. Food distributors, building and electrical wholesalers, manufacturers delivering to customers with their own trucks. Here transport is a cost, often the second largest after staff, and it is almost always buried in the product price. The value lies in route planning, cost per delivery and the cost to serve each customer, which is the item that decides whether that customer makes you money. The link with what you hold in stock is direct, and I covered it in warehouse management software.
Companies that hand transport to external carriers. Manufacturers shipping pallets and parcels with three, five, ten different couriers and hauliers. There are no trucks to plan here, but there are rates to compare, carrier invoices to check and performance to measure. The value lies in picking the right carrier for each shipment and checking invoices, where in my experience you almost always find errors in the carrier's favour of two to five per cent.
All three buy products with the same name and use different parts of them. Before you watch any demo, decide which one you are. Most of what follows applies to the first two, where the trucks are yours; for the third, the number that decides is not empty kilometres but cost per shipment compared with the market, and I will flag where things change.
The real bill: what planning routes by hand costs you

This is the calculation almost nobody does, because none of these items has a line in the accounts: they are diesel, hours and margin disappearing into an average. I take as a reference a distribution and transport company with six million euro in revenue, twenty five vehicles between rigid trucks and articulated lorries, thirty two drivers and roughly two point six million kilometres a year. It is a very common size among the people who write to me, and the numbers scale reasonably well with kilometres.
A warning about cost per kilometre, because the whole calculation depends on it. For a heavy vehicle the full cost, with driver, depreciation, insurance and overheads, sits today between one euro fifty and one euro ninety per kilometre. But when you reason about kilometres you could have avoided, not all of that cost disappears: you pay the driver and the vehicle anyway. What really disappears is the variable part, meaning diesel, tyres, mileage based maintenance and tolls, which is around ninety cents. I use that, so as not to inflate anything.
Empty kilometres that could have been avoided
This is the largest item and the least visible. On two point six million kilometres, every percentage point of empty running is worth twenty six thousand kilometres. If your empty share is five points above what you could reach by planning return legs, looking for loads on fixed lanes and consolidating small drops, you are paying for one hundred and thirty thousand useless kilometres, about one hundred and twenty thousand euro a year in variable cost alone.
Not all empty running can be eliminated, and anyone who promises to bring it to zero does not know the trade. A distributor delivering to shops comes back empty by nature, unless it collects returns and packaging. A haulier with fixed lanes heading south comes back empty if it has no customers in the south. But there is almost always a share of empty running that exists only because nobody ever looked at it lane by lane, and that share is easy money.
Routes planned by hand and trips longer than they need to be
The good person in the traffic office builds good routes, often excellent ones, for the customers they know. The trouble starts when there are sixty drops in the day, twelve vehicles and a different opening time for every customer: there, in my experience, hand planning leaves between five and ten per cent of kilometres on the table compared with a computed plan. Not because the person makes mistakes, but because there are too many combinations for one head at seven in the evening.
On loaded kilometres, a six per cent difference is worth about one hundred and fifty thousand kilometres, and here I count only diesel and wear because the vehicle goes out anyway: up to eighty five thousand euro a year. On top of that comes a cost you do not see in diesel but in the overtime of drivers coming back late, and in customers served outside their window who call someone else next time.
Waiting time at loading and unloading that nobody charges
The truck arrives at eight and is unloaded at eleven. It happens every week, always with the same customers, and almost nobody invoices it. Road haulage rules in many countries, Italy included, provide compensation for waiting beyond a free allowance, but claiming it takes something almost nobody has: arrival and end of unloading times recorded in a way the customer cannot dispute. Without it the claim becomes an argument, and nobody picks an argument with an important customer.
The cost is not just the lost compensation. Three hours of a vehicle and a driver standing still are three hours you did not sell to anyone else, and on a route with five drops they push back every drop that follows. Between unclaimed compensation and lost capacity, up to sixty thousand euro a year. And the same information, reliable times, feeds an even more important decision: renegotiating price with the customers who always keep you waiting.
Failed deliveries, redeliveries and disputes without proof
The shop is closed, the customer is not there, the gate is locked. The truck comes back with the goods and the delivery is redone two days later. Or the goods are delivered, but three weeks later the customer says two parcels were missing, and the only proof is an illegibly signed delivery note sitting in a binder. In a company this size, between redeliveries, goods credited to avoid an argument and hours spent looking for paperwork, it adds up to fifty thousand euro a year.
This is the item that comes down fastest, because the solution is simple and mature: digital proof of delivery, with a signature on the driver's phone, a photo of the parcels and a recorded position. It costs little, drivers learn it in a week, and from then on disputes close with a message instead of a meeting.
The traffic office rebuilding the day by hand
There is one person who calls drivers the next morning to find out how it went, one who collects signed delivery notes and checks them against orders, and one who prepares trip invoices by pulling together kilometres, stops, surcharges and tolls from four different sources. That is between one thousand and one thousand five hundred hours a year, between twenty five and forty thousand euro, done by people who know the work better than anyone and spend half their time rebuilding instead of planning.
The total, for a company with twenty five vehicles, sits between eighty and three hundred and fifty five thousand euro a year, and no company hits all five items at the maximum. The range is wide because the real variable is not the number of vehicles: it is how fragmented your deliveries are. Those running few long full trips sit at the bottom, those running many small drops with tight time windows sit at the top. Run the numbers with your own figures, even roughly, on a single sheet. If your total is below twenty five thousand euro a year, software is not your most urgent problem, and further on I will tell you what is.
Empty kilometres: the number that decides whether the project makes sense

If I could keep only one number from this whole article, I would keep this one: how many of the kilometres your vehicles drove last year were driven with a load below ten per cent of their capacity. I simply call it the empty share. It decides everything, because every function of transport management software, from planning to finding return loads to vehicle utilisation, works to bring that number down, and if you do not know where you start you cannot know whether the system you buy is bringing it down.
The reason this number matters more than the map, the dashboards and average fuel use is that it rolls every planning error into a single figure: empty returns, overlapping routes, small drops made with the big vehicle, trucks sent out for one pallet. And it is a number you cannot fudge with an average, because every kilometre either had a load or it did not.
How to measure it, in a day
You need two things you almost certainly already have. The first is kilometres per trip, which live in vehicle tracking, in the tachograph or, at worst, in drivers' trip sheets. The second is load per leg, which you rebuild from delivery notes: you know what went on at loading and what came off at each drop, so you know how much weight was on the vehicle between one stop and the next. The day's work is putting the two together over a period long enough to be honest, and three months is the minimum.
If the data already sits in a database, the measurement is a query. This is the shape I use on SQL Server. Table names in your system will differ, the substance will not:
-- Share of empty kilometres per vehicle over the last twelve months
-- A leg with a load below 10% of capacity counts as empty
SELECT v.Plate,
       SUM(l.Km) AS TotalKm,
       SUM(CASE WHEN l.LoadKg < v.CapacityKg * 0.10 THEN l.Km ELSE 0 END) AS EmptyKm,
       SUM(CASE WHEN l.LoadKg < v.CapacityKg * 0.10 THEN l.Km ELSE 0 END) * 100.0
         / NULLIF(SUM(l.Km), 0) AS EmptySharePercent
FROM Legs AS l
JOIN Vehicles AS v ON v.VehicleId = l.VehicleId
WHERE l.DepartureDate >= DATEADD(MONTH, -12, CAST(GETDATE() AS date))
GROUP BY v.Plate
ORDER BY EmptySharePercent DESC;
Setting the threshold at ten per cent is not a detail. An articulated lorry carrying a three hundred kilo pallet is technically loaded, but economically it is running empty, and counting it as loaded is the most common way to get a reassuring number. If you want a second indicator, also compute the average utilisation of loaded kilometres, meaning how full the vehicle was when it was not empty: the two figures together say almost everything.
Then do the second pass, the one that tells the truth: repeat the same calculation by lane or area, not only by vehicle. Replacing the plate with the trip's main destination in the grouping is enough. The overall empty share can look acceptable and hide a fixed lane that has been coming back empty for years, offset by full local routes. That is exactly the case of the owner with the whiteboard, and on its own it was worth more than any software.
Three caveats, because the measurement is easy to distort without meaning to. Do not exclude odd trips because they look like exceptions: the urgent drop made with the big vehicle on Friday afternoon is the rule, not the exception. Do not use the navigator's theoretical kilometres instead of the ones actually driven, because the gap between the two is valuable information in itself. And do not measure only heavy vehicles: vans drive fewer kilometres, but in distribution companies they often have the highest empty share.
In companies with their own fleet that never measured it, the result often sits between fifteen and thirty per cent. For those who hand everything to external carriers, the measurement changes form but not substance: the number that decides is cost per shipment, per pallet or per hundred kilos, compared by carrier and by area with what you would pay by putting the same shipment out to tender. The gap between your usual carrier and the best available one, on the same lanes, does the job the empty share does for an own fleet.
The four thresholds, and what you can do at each
Below fifteen per cent: you plan well. You are in the minority, and your problem is not empty running but utilisation and cost per delivery. Here a system pays back mainly through digital proof of delivery, exact invoicing of waiting time and cost per customer. You can skip much of what follows and go straight to the choice.
From fifteen to twenty five per cent: recoverable margin. This is the most common band among companies distributing with their own fleet. Empty running does not come from one big error but from many small choices made from memory: the return leg nobody tried to fill, the big vehicle used for convenience, two routes passing through the same area at different times. A good planning tool recovers five or six points here within a year.
Above twenty five per cent: the problem is commercial, not technical. With empty running that high no route optimiser works miracles, because return loads do not exist: they have to be found. The work is listing the lanes that come back empty and putting that list in the hands of sales, or partnering with other hauliers on the same corridors. Software helps you see the lanes, but customers for the return leg are brought in by a person.
Never measured: you do not know. It is the most common case of all, and it is nobody's fault: kilometres live in one system, loads in another, and nobody was ever given the job of joining them. The first job is not buying software, it is doing this measurement once, over three months. One day from someone who knows the data is enough, and the result changes the conversation with any vendor.
The practical rule is a single one: before you buy a system that optimises your routes, get hold of the number that system will have to bring down, because without a starting point nobody will be able to tell you whether it worked. Serious vendors ask you for it themselves. The ones who do not will sell you the map.
Planning routes: where software earns its keep and where it falls short
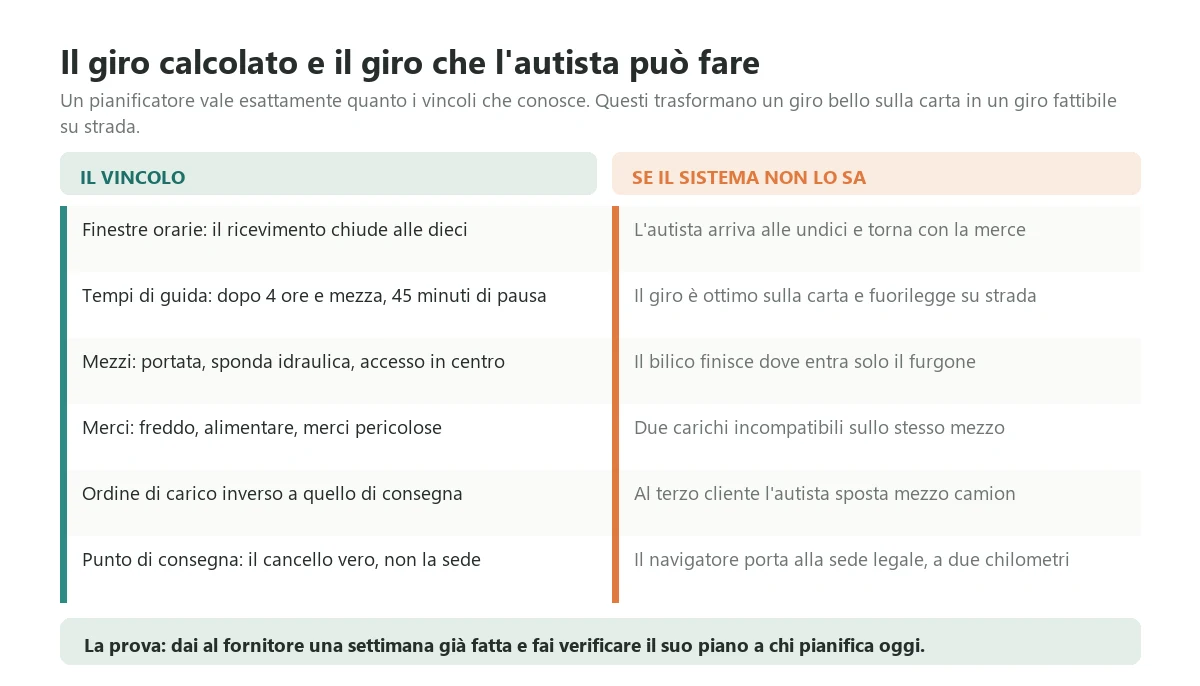
This is the heart of the trade, and it is where demos are most misleading. In the demo the optimiser takes fifty addresses and ten vehicles, and in three seconds draws ten coloured routes that drive twenty per cent fewer kilometres than today. It is all true, mathematically. Then the route reaches the driver, and the driver explains that the customer on Via Roma only receives until ten, that the articulated lorry cannot get into the centre of Vicenza, that the supermarket wants a vehicle with a tail lift and that by half past four he has already driven four and a half hours and has to stop.
The difference between a computed route and a feasible one lies entirely in the constraints, and constraints are your company's real asset, the one that today lives in the heads of the traffic office. A planning system is worth exactly as much as the constraints it knows.
The constraints a planner must know, or it draws impossible routes
Customer time windows. Goods receiving hours, times when unloading is not allowed, closing days. It is the constraint that weighs most in distribution and the most neglected in master data: almost always it is written in a free text note, or not written at all.
Driving and rest times. European Regulation 561 of 2006 sets nine hours of driving a day, extendable to ten twice a week, a forty five minute break after four and a half hours, and limits of fifty six hours a week and ninety over two weeks. A route that ignores them is not optimised, it is illegal, and the driver pays at the first roadside check.
Vehicles and their characteristics. Payload, volume, number of pallets, tail lift, refrigerated body, authorisation for dangerous goods, access to restricted traffic zones. Two vehicles with the same payload are not interchangeable, and vehicle data that knows it is half the job.
Compatibility between goods and between customers. Food and non food, temperature controlled goods, products that cannot travel together, customers who want to be served first. And the loading order, which must be the reverse of the delivery order, otherwise at the third customer the driver is moving half the truck.
The real delivery point. The goods receiving gate is not the registered office address, and in an industrial area it can be two kilometres away. A route computed on billing addresses is a route computed for a different company.
The habits that really matter. The driver who knows the difficult customer, the area you cannot get through at midday, the customer who pays well and deserves better treatment. Not everything belongs in the system, but what matters has to be written down, otherwise the system proposes every day the route nobody will run and after a month nobody opens it any more.
Cost per delivery, and why it comes before kilometres
There is an intermediate number that makes different routes, vehicles and customers comparable, and it is cost per delivery: the route cost divided by the drops made. It has a useful property: it puts on the same footing the articulated lorry making three drops of twenty pallets and the van making twenty two drops of two parcels, and it tells you immediately which customer costs more than it earns. In distribution it is the basis for deciding minimum order size, a fixed delivery day per area and the surcharge for urgency.
The calculation is simple arithmetic, and it is worth seeing it written down because it makes clear where the decision comes in. This is a C# example that compiles and runs: it computes the empty share and cost per delivery over a set of routes, with the load threshold below which a leg counts as empty.
using System.Collections.Generic;

public sealed record Leg(string From, string To, decimal Km, decimal LoadKg);

public sealed record Route(string Vehicle, decimal CapacityKg, IReadOnlyList<Leg> Legs, int Deliveries);

public static class TransportIndicators
{
    // A leg with a load below the threshold counts as empty kilometres
    public static (decimal EmptySharePercent, decimal CostPerDelivery) Compute(
        IReadOnlyList<Route> routes,
        decimal costPerKm,
        decimal loadThreshold = 0.10m)
    {
        var totalKm = 0m;
        var emptyKm = 0m;
        var deliveries = 0;

        foreach (var route in routes)
        {
            foreach (var leg in route.Legs)
            {
                totalKm += leg.Km;

                if (leg.LoadKg < route.CapacityKg * loadThreshold)
                {
                    emptyKm += leg.Km;
                }
            }

            deliveries += route.Deliveries;
        }

        if (totalKm == 0m || deliveries == 0)
        {
            return (0m, 0m);
        }

        return (emptyKm * 100m / totalKm, totalKm * costPerKm / deliveries);
    }
}
The interesting part is not the code, which is trivial: it is the two parameters, cost per kilometre and load threshold. Cost per kilometre is a management decision, not a technical fact: use full cost and you get a number useful for pricing, use variable cost and you get a number useful for deciding whether an extra route pays. When a vendor tells you their product computes cost per delivery, there is one question to ask: with which cost per kilometre, who updates it when diesel goes up twenty cents, and whether it is the same for an articulated lorry and a van.
And there is a check that takes ten minutes and that I always recommend: the sum of route costs for a month, computed this way with full cost, must come close to what the accounts say you spent on diesel, maintenance, tolls, vehicles and drivers in the same month. If the gap exceeds ten per cent, the cost per kilometre is wrong and every cost per delivery derived from it is wrong with it. It is the same principle as the reconciliation between cost accounting and statutory accounts I described in management control software, applied to trucks.
How far a spreadsheet and a phone take you
Almost every Italian traffic office works with a spreadsheet, a phone and a messaging group with the drivers, and that is not a flaw: it is a flexible tool everyone knows how to use and it adapts to any surprise. I have seen companies with fifteen vehicles planned better by hand than others with fifty vehicles and an eighty thousand euro system. The point is not whether the spreadsheet is enough, but when it stops being enough, because it stops quietly: it does not break, it starts costing a little more every month, and nobody notices.
The five conditions that bring it down
The number of drops a day. Up to thirty or forty drops a day on a few vehicles, an experienced person plans well by hand. Beyond sixty, and especially with tight time windows, there are too many combinations and the jigsaw leaves kilometres on the table that nobody sees.
The one person who knows everything. If only one person knows how to plan, that person is the system. The day they are on holiday someone else builds the routes and the month's diesel bill proves it. The cost is not time, it is risk: if that person leaves, they take the real customer data with them.
Proof of delivery. While disputes are rare, the signed delivery note in the binder is enough. When customers become large chains with their own claims departments, you need proof you can find in a minute, with time, signature and photo. It is the condition that on its own justifies a driver app, even when everything else still holds.
How many systems you have to join. Orders from the ERP, positions from tracking, times from the tachograph, loads from the warehouse, carrier invoices by email. From the third manual transfer on, every evening is craftwork, and every month end invoicing is a reconstruction.
Whether customers want to know where their goods are. The moment customers ask for an expected arrival time, delivery status or access to signed documents, you need a portal or automatic notifications. Answering thirty calls a day to say the truck is on its way is work that produces nothing.
My rule of thumb: if two of these five conditions hold, you are at the limit and have time to organise. If three or more hold, the spreadsheet is already costing you more than a system, only you pay in diesel, overtime and disputes instead of invoices. And I will add something no vendor will tell you: if none or one holds, stay where you are, measure the empty share, clean up customer data and postpone the spend by a year.
What you carry over and what you throw away
When you move to a system, the spreadsheet and the whiteboard are not thrown away: they are the best specification you have. They hold the fixed routes that work, the customers to serve first, the areas that go together, the exceptions nobody ever wrote down anywhere else. The first serious job in a transport management project is sitting with whoever plans, for two or three evenings, and writing down the rules they use, including the ones they do not know they use until you ask.
What gets thrown away are the phone fixes nobody remembers the reason for, and the fixed routes that exist only because they have always been run that way. Every fixed route should be tested against the data: if it really is the best, the system will confirm it; if it is not, you have found money. If the new system merely reproduces the whiteboard in digital form, you have bought a more expensive whiteboard.
TMS, tracking and ERP: three different things with the same name
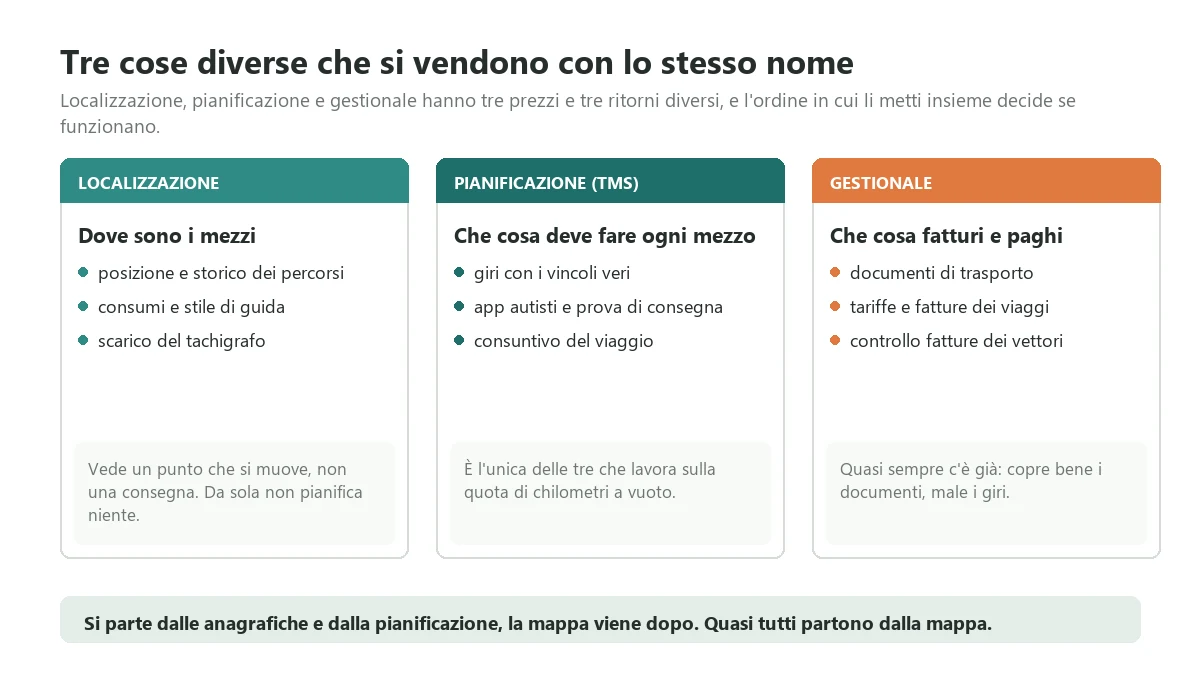
The three families of tools have three prices and three different returns, and the order in which you put them together decides whether they work. I line them up with what they really cover, because in quotes they arrive mixed together and comparing two offers becomes impossible.
Tracking and telematics answer where the vehicles are and how they are driven. Real time position, route history, fuel use, driving style, tachograph downloads, alerts. It is the most mature part of the market, it costs little per vehicle and you often already have it. On its own it plans nothing and knows nothing about your loads: it sees a moving dot, not a delivery.
Planning and execution, the real TMS, answer what each vehicle has to do and what it did. Transport orders, routes, assignment of vehicles and drivers, optimisation, a driver app with proof of delivery, handling surprises during the day, trip costing. It is the part that produces the saving, and the only one that works on the empty share.
The ERP and invoicing answer what you have to invoice and pay. Delivery notes, customer rates, trip invoices, carrier invoice checks, costs by job or by customer. It almost always exists already, and its transport module, where there is one, covers documents well and planning poorly.
The sequence that works, and the one you see around
The sequence that works is: clean master data, then planning and execution, then connection to tracking and invoicing. The sequence you see around starts from tracking, because it is the visible part and the one the leasing company offers, and it produces a typical result: a beautiful map with twenty five moving dots, opened every morning by the owner, that has not changed a single kilometre of the routes. The vendor delivered what was promised, and the original question, why are we spending so much on diesel, is still unanswered.
There is an honest exception, and it is when your main problem is disputes and safety, not kilometres. In that case starting from telematics with proof of delivery costs little and has an immediate effect. But the result should be measured with the empty share and the number of disputes before and after, not with the number of features switched on.
What transport management software costs: product, module or custom
The figures below are the ones I see in quotes for Italian companies with between ten and a hundred vehicles. They are not price lists: they are the order of magnitude to compare what you receive against, and above all they help you spot the quote that is low because it is incomplete.
Tracking, kept separate
Tracking with tachograph downloads costs between fifteen and thirty five euro per vehicle a month, with installation of a few tens of euro per vehicle or included in the lease. Keep it as a separate item in comparisons, because almost every TMS integrates it but few replace it. If you already have it and it works, the first question for every vendor is whether they read it as it is, without swapping the box.
The module of the ERP you already own
Many Italian ERPs for distribution and haulage have a transport module. Turning it on costs between five and twenty five thousand euro, almost all configuration. It covers documents, rates and trip invoicing well, and that alone cuts the item of the office rebuilding the day. It is the route to evaluate first if your main problem is invoicing rather than planning.
The limit is almost always planning. ERP modules treat a route as a document, not as a problem to solve: you can assign drops to vehicles, but nobody tells you which assignment is best, and the driver app is often missing or a third party add-on. If your empty share is low, that is perfectly fine. If it is high, the module records the useless kilometres with great precision.
The specialised product
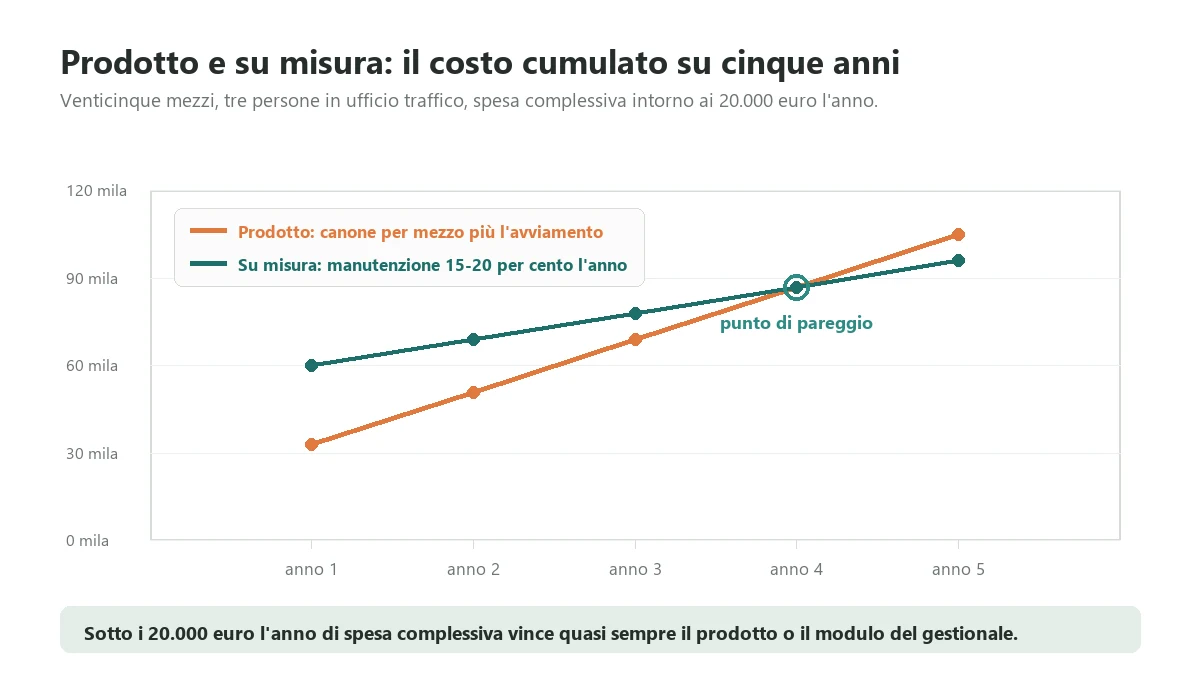
These are vertical TMS products sold by subscription, with planning, optimisation, a driver app and a customer portal. The bands I see run from thirty to ninety euro per vehicle a month, depending on modules and the number of office users, plus setup between five and thirty thousand euro covering master data, the ERP connection and training for office and drivers. For twenty five vehicles that is around eighteen thousand euro a year in subscription.
Setup is the item quotes squeeze to look competitive, and it is the item that then grows, for two reasons that always repeat: the ERP connection is more laborious than expected, and delivery point data has to be rebuilt almost from scratch because half the addresses do not match the real gate. The two questions to ask are always the same: what does connecting it to my ERP cost, naming the product and version, and what happens to my data if I stop after two years.
Custom
A system built around the way you work starts at thirty five thousand euro for the core, meaning transport orders from the ERP, planning with your constraints, a driver app with proof of delivery, trip costing and cost per delivery. It reaches one hundred and eighty thousand with advanced optimisation, a customer portal, electronic data exchange with shippers and automatic carrier invoice checks. Add fifteen to twenty per cent a year in maintenance, which keeps the system alive when you change ERP, when a customer arrives with new rules or when a regulation changes.
It makes sense in three cases, and outside them it is almost always a waste. When your way of planning is your competitive advantage, for instance because you deliver with constraints no product handles, such as installations with crews and materials together or temperature controlled services with strict traceability. When the systems to connect are many and varied, and no product joins them without customisation that costs as much as building. And when the ERP you have works and should be kept, building the missing part around it instead of replacing it, which is the most frequent situation and the most underrated.
The threshold, and the variable that is not financial
The rule of thumb I use is this: below twenty thousand euro a year of total expected spend, subscriptions and customisation included, the product or the ERP module almost always wins. Above that, redo the maths, because at that level five years of subscription reach the cost of building and the difference is all maintenance, which you pay either way. In the chart, for twenty five vehicles, the break-even point falls around year four.
At that point a variable that is not financial matters: how much your way of delivering will change in five years. If you expect to add a depot, move into cold chain, serve large retailers with their rules or buy a competitor, the flexibility of a system of your own is worth the premium, because every change in a product is a customisation request with its own timeline. If your work has been stable for ten years, the product is the rational choice and custom is a luxury.
The questions to ask before signing, and the test that breaks demos
Transport management demos are all convincing, because they show optimised routes on clean addresses and customers without constraints. The way to come out with real information is to bring your hard cases and watch how the person in front of you reacts. It is three weeks of work, and worth more than any comparison of feature sheets.
Week one: prepare your five cases
Write on one page the five cases the system must handle, taken from your real life. Here are the ones that in my experience break the most quotes. The customer who only receives from seven to ten and the day before asks to move the delivery: how the route is replanned without redoing everything. The vehicle that breaks down at ten with eight drops on board: how they are redistributed across the others. The delivery with two unloading points and a returns pickup on the way back. The driver who by two in the afternoon has already driven eight and a half hours. And the customer who disputes a missing parcel three weeks later: in how many seconds you find the proof.
These five cases have a useful property: they are not solved by a feature, they are solved by a written rule and a system that applies it. People who know the trade ask you questions and then show you how the rule goes into the system. People who only know the product show you the map.
Week two: the same questions for everyone
Ask every vendor in the same order, so the answers can be compared. What the total cost is in year three, with the vehicles and users you will have in three years. What connecting the ERP I have costs, naming the product and version, and who does it. Whether it reads the tracking I already have or I have to swap the box. How long the traffic office needs to plan a day with sixty drops, measured on a real customer. How the driver app works with no signal, in a mountain valley. What happens if I stop after two years, in what format my data comes out and what extraction costs. And whether I can talk to two companies like mine, without the salesperson present.
The most informative moment is when you ask for something off script and watch how they react. Someone who knows the product tells you straight away that it cannot be done and how to work around it. Someone who does not, promises, and then files a development request after signing.
Week three: the test on a week already driven
This is the test I always recommend and almost nobody runs. Take a week already closed, for which you know the kilometres driven, the vehicles used and the costs. Give the vendor that week's orders, with the real customer and vehicle constraints, and ask them to plan it. Then compare the kilometres and vehicles in their plan with what you actually did, and have the traffic office check the plan: how many of those routes could really have been run.
It is not a feature test, it is a method test: you watch how many questions they ask before planning, which constraints they discover are missing from your master data, and how long it takes. If the plan is feasible and drives fewer kilometres, you have found your vendor and an estimate of the saving too. If it is not feasible, you have found where the problem is before paying for it, and the problem is almost never the optimiser: it is a constraint only one person in the company knows.
The three things to fix before buying anything
There are three jobs that cost little, take a few weeks and without which any transport management software delivers half its value: cleaning delivery point data, computing your true cost per kilometre, and choosing the five numbers you discuss. Do them before, not after, because after the project has started the rules are decided by whoever configures it, meaning a consultant who has never seen your customers.
Delivery point data. Every delivery point needs the coordinates of the real gate, not the registered office address, receiving hours, closing days, the type of vehicle that can get in and the notes that matter. In my experience one address in three does not match the point where the truck actually unloads. It takes a few weeks, drivers do it better than the office, and on its own it produces part of the result, because every route computed on wrong addresses is wrong.
The true cost per kilometre. Take last year's costs for each vehicle: diesel, tyres, maintenance, tolls, insurance, depreciation or lease, and the drivers' share. Divide by kilometres driven. Then split the variable part from the fixed part. It is two or three days with whoever keeps the books, and from then on every discussion about a route, a customer or a price happens on a real number. If you work on jobs, the same number goes into job cost, as I explained in job costing software.
The five numbers you discuss. Pick five indicators and stop there for a year. In most companies with their own fleet these work: share of empty kilometres, average utilisation of loaded vehicles, cost per delivery, percentage of drops within the time window, and hours waiting at loading and unloading by customer. Five numbers looked at every week change the way you plan; twenty indicators on a dashboard change nothing, and by the second month nobody looks at them.
I will add a way to start that is not a job but a choice: begin with one area, or one depot, and run it for two months before extending. Companies that start on the whole fleet at once reach week three with drivers who have stopped using the app and an office back at the whiteboard. The second attempt is much harder, because by then everyone knows the thing did not work.
If your total of the five items was below twenty five thousand euro a year, here is your most urgent problem: these three jobs, not software. Do them, measure the empty share again after six months, and only then look at products.
Where to start
You start from a small first release, because a transport management system is not an IT project: it is a project to change habits, in the office and among drivers, and habit changes succeed when they ask for few things at a time. The first release that almost always works is this. Transport orders taken from the ERP without retyping them. Route planning with time windows and vehicle characteristics, leaving the final word to the traffic office. A driver app with the list of drops and proof of delivery with signature and photo. A single report, on Monday morning, with the empty share, cost per delivery and waiting time by customer for the previous week. Nothing else.
With that scope you are operational in a few weeks with a product, in two or three months if you build custom. From then on you repeat the empty share measurement every month. If it goes down, the project is working. If it does not, the problem lies in the constraints, the master data or the return loads nobody is looking for, and no extra feature will fix it. Everything else, advanced optimisation, the customer portal, data exchange with shippers, carrier invoice checks, is built on top of a number you can trust, and it costs less because by then you know what you really need.
The owner with the whiteboard, in the end, bought nothing for the first two months. He had the empty share measured lane by lane, gave sales the list of empty returns from Bologna and Brescia, and within three months found two customers filling those returns four days out of five. The system came later, to plan local deliveries, and it cost less than what he was about to buy, because by then he knew exactly what it had to do. The whiteboard still hangs in the office, and they use it for holiday schedules.
If you are running these numbers now and want to know which side of the threshold you are on before spending anything, send me two pages: how many vehicles you have, what your deliveries look like and which systems orders, kilometres and documents come out of today, plus the two numbers from the test, meaning the share of empty kilometres over the last three months and the total of the five items. In half an hour I will tell you whether yours is a master data problem, a product problem, a problem for the ERP module you already own or a custom one. When it is a commercial problem I will tell you that too, because a customer who buys the wrong thing comes back angry. You can get in touch to run those numbers together.
If instead you are still framing the problem, three reads sit around this one. What happens before the truck leaves, meaning picking and load preparation, is in warehouse management software. The real cost of serving each customer, reconciled with the statutory accounts, is in management control software. And if you deliver what you make, the source of the ship dates you promise customers is production management software.
Frequently asked questions
It depends on the route. The transport module of the ERP you already own costs between five and twenty five thousand euro, almost all configuration. A specialised subscription product costs between thirty and ninety euro per vehicle a month, plus setup between five and thirty thousand euro. A custom system starts at thirty five thousand euro for the core and reaches one hundred and eighty thousand with advanced optimisation, a customer portal and data exchange with shippers, plus fifteen to twenty per cent a year in maintenance. Vehicle tracking is a separate item, between fifteen and thirty five euro per vehicle a month.
Tracking answers where the vehicles are: real time position, route history, fuel use and tachograph downloads. A TMS answers what each vehicle has to do and what it did: transport orders, routes built on customer and vehicle constraints, a driver app with proof of delivery and the trip cost. Tracking sees a moving dot, a TMS sees a delivery, and only the TMS works on empty kilometres.
Take kilometres per trip from tracking or the tachograph and the load per leg from delivery notes, for at least three months. Every leg driven with a load below ten per cent of the vehicle's capacity counts as empty. Empty kilometres divided by total kilometres is the share. Then repeat it by lane or area, because an acceptable overall share can hide a fixed lane that has been coming back empty for years. In companies with their own fleet that never did it, it often sits between fifteen and thirty per cent.
Yes, if it knows the real constraints. Compared with routes planned by hand with many drops and tight time windows, a computed plan usually drives five to ten per cent fewer kilometres. But an optimiser that does not know receiving hours, driving and rest times, vehicle characteristics and the real delivery point produces beautiful routes no driver can run. The saving depends more on the quality of your master data than on the algorithm.
When at least three of these five conditions hold: deliveries exceed sixty a day with tight time windows, only one person knows how to plan, customers demand proof of delivery you can find in a minute, you have to join three or more systems through manual transfers, or customers want to know where their goods are without calling. With two conditions you are at the limit and have time; with none or one it is better to stay where you are, measure the empty share and clean up customer data.
With three jobs that come before any purchase: delivery point data with the real gate, receiving hours and the vehicles allowed; the true cost per kilometre by vehicle, separating variable from fixed; and five indicators chosen and kept unchanged for a year. Then a small first release on one area or one depot, with orders from the ERP, routes with time windows, a driver app with proof of delivery and a weekly report. Extend after two months, not before.
Below twenty thousand euro a year of total spend the product or the ERP module almost always wins. Custom makes sense in three cases: when your way of planning is your competitive advantage, for instance with constraints no product handles; when the systems to connect are many and varied and no product joins them without costly customisation; and when the ERP you have works and should be kept, building the missing part around it. With twenty five vehicles the break-even between the two routes usually falls around year four.
Leave your details in the form below